Product Analytics
Note: Only Organization Owners and Admins can access this section.
The Product Analytics section provides an overview of how the users of your Organization are using Contentstack.
Note: The "Product Analytics" dashboard is a plan based feature and may not be available to everyone. Contact our support team to enable it for you.
To access the analytics for your Organization, log in to your Contentstack account and perform the following steps:
- Select the Organization from the dropdown on the header and click on the “Org Admin” icon in the left navigation panel.
Or, you can simply click on the “Org Admin” cog beside the Organization that you intend to open.
- Click the Product Analytics tab to access the dashboard.
This section contains the following subsections:
- Subscription Usage: Displays the number of extensions, users, stacks, content types, global fields, entries, assets, environments, executions etc. currently existing in the organization.
- Usage by Stacks: Provides detailed information of each stack created in the organization. The usage in terms of how many content types, global fields, entries, assets, environments, locales, extensions, webhooks, and custom roles, etc., have been created.
- Usage Analytics: Provides details of the Bandwidth and APIs Requests usage.
- Top URLs: Provides details of the frequently hit API calls.
- Apply Filter: Filter out the API Usage and Top URLs data.
Note: You can view the usage information based on an individual stack.
Subscription Usage
Within the Subscription Usage section, you can view three tabs that display data individually:
- CMS: The “Usage Overview” section displays the number of extensions, bandwidth, API requests, users, stacks, content types, global fields, entries, assets, environments etc., currently existing in the Organization.
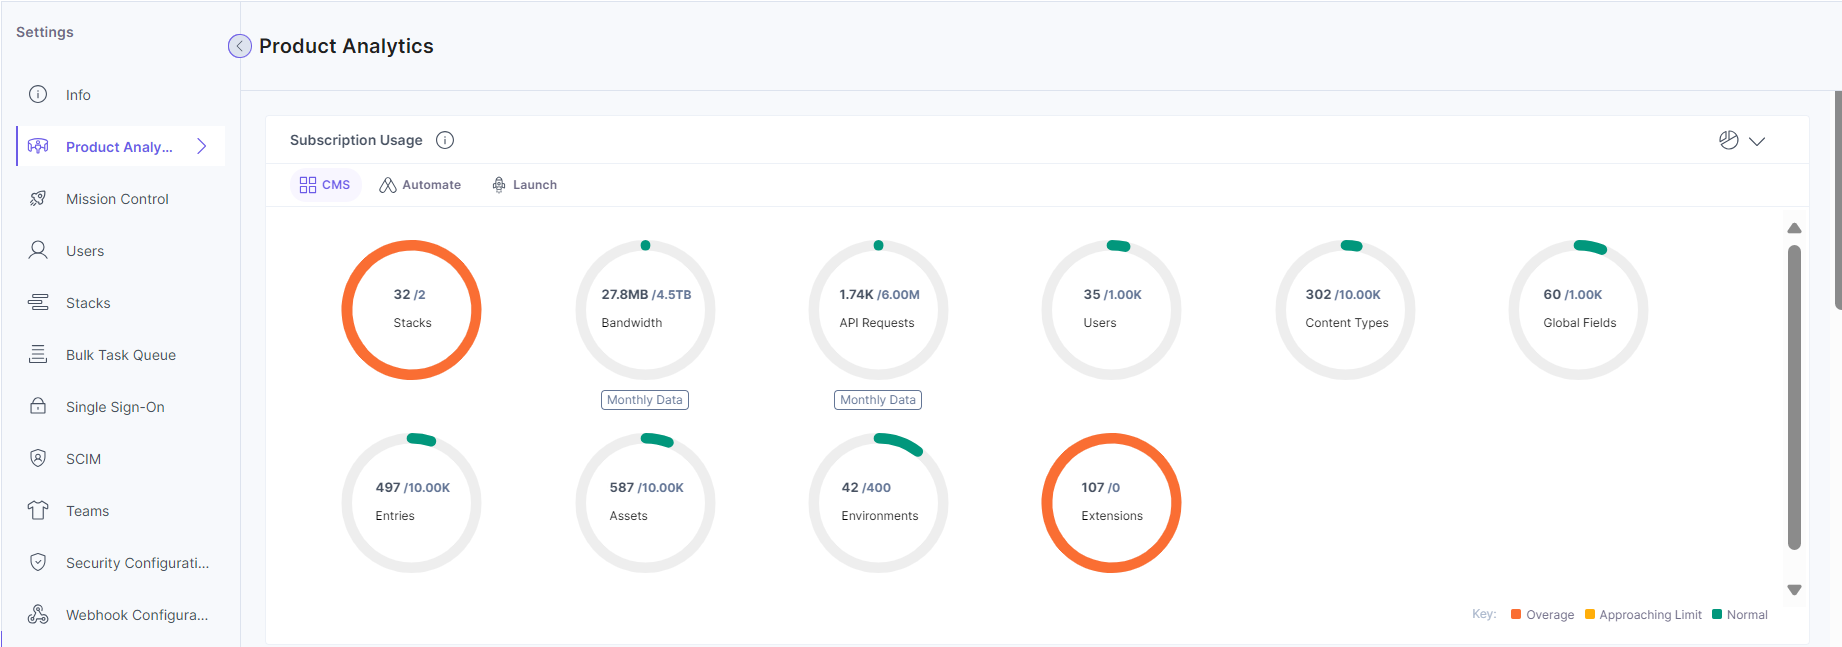
Note: The data in this section is updated on a real-time basis.
- Automate: In the Executions usage count, users can view the number of executions performed in Automate.
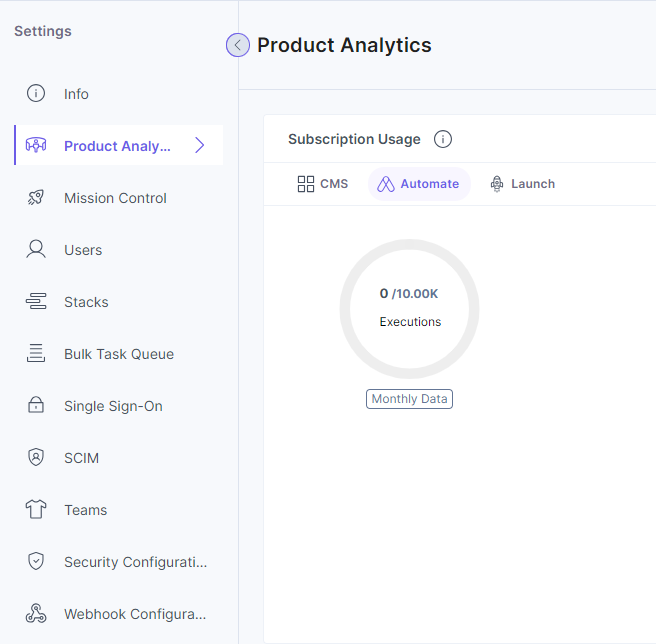
Note: The data in this section is updated every 24 hours.
- Launch: In the Launch usage count, users can view the execution time (monthly basis), projects, and environments.
- Projects: Projects are individual applications or websites deployed using Launch. You can view the total number of projects being deployed here.
- Environments: With environments, you can create different versions of your project and deploy them with a unique URL.
- Execution Time: Execution Time is the usage of server-side functionality calculated in hours on a monthly-basis.
Note: The usage count for Launch Projects and Environments is the total created till date. Also, you can view ‘n’ number of projects and environments but when the limit exceeds, then the color changes to red to signify the exceeded limit.
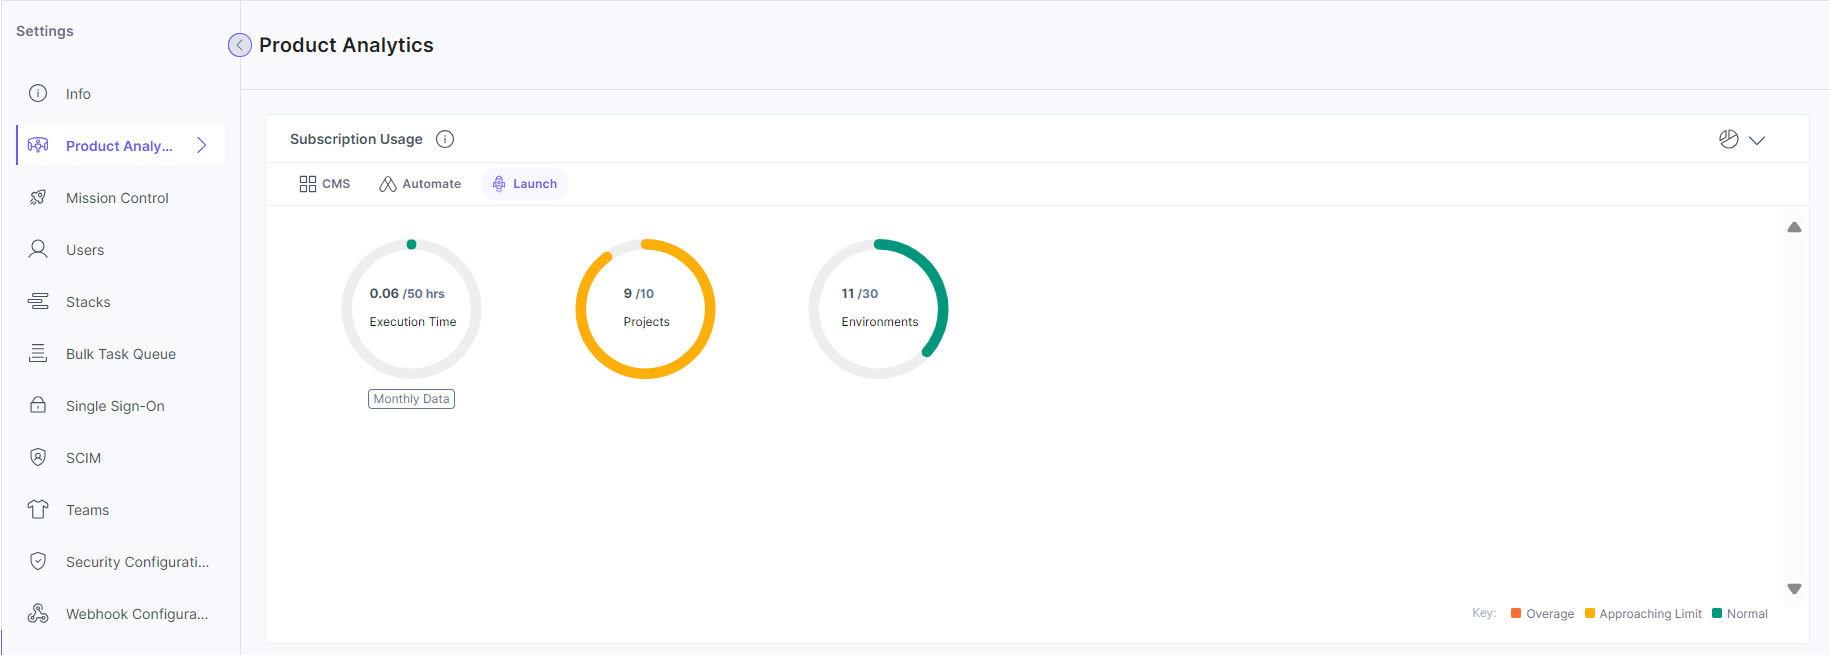
Note: The data in this section is updated every 24 hours.
Users can toggle between table and pie view by clicking the dropdown in the top right-hand corner.
Usage by Stacks
The Usage by Stacks section under the Product Analytics tab of your Organization's Settings page gives a quick overview of the usage of various entities by the stacks of your organization.
Following are some of the specifics mentioned:
- Stack Name: Name of all the stacks within your Organization.
- API Key: API keys of the listed stacks.
- Owner: Email addresses of the owners of the listed stacks.
- Content Types: Number of content types within the stacks.
- Global Fields: Number of global fields within the stacks.
- Entries: Number of entries created within the stacks.
- Assets: Number of assets present within the stacks.
- Environments: Number of environments created within the stacks.
- Locales: Number of languages created within the stacks.
- Extensions: Number of extensions created within the stacks.
- Webhooks: Number of webhooks created within the stacks.
- Custom Roles: Number of custom roles within the stacks.
- Branches: Number of branches within the stacks.
- Branch Aliases: Number of branch aliases within the stacks.

Note: Global Fields, Extensions, Branches, and Branch aliases are plan based features. You will be able to view the above features if you have access to the plan. Please contact the support team to add these features to your plan.
Click the Full Screen icon to view the data in full screen.
Additionally, you can save a copy of these statistics by downloading the chart. Click the Export icon in the top right corner of this section to download the Excel file.
Note: The data in this section is updated on a real-time basis.
Usage Analytics
The Usage Analytics section provides a quick overview of the following metrics:
- Bandwidth
- API Requests
Note: The data in this section is updated every 24 hours.
Bandwidth
The Bandwidth section gives you an overview of your data usage in the form of a bar chart. The dates are mapped on the X-axis and the corresponding Bandwidth usage (in MB) is mapped on the Y-axis.
Set the time frame of your choice and get the desired results as shown below: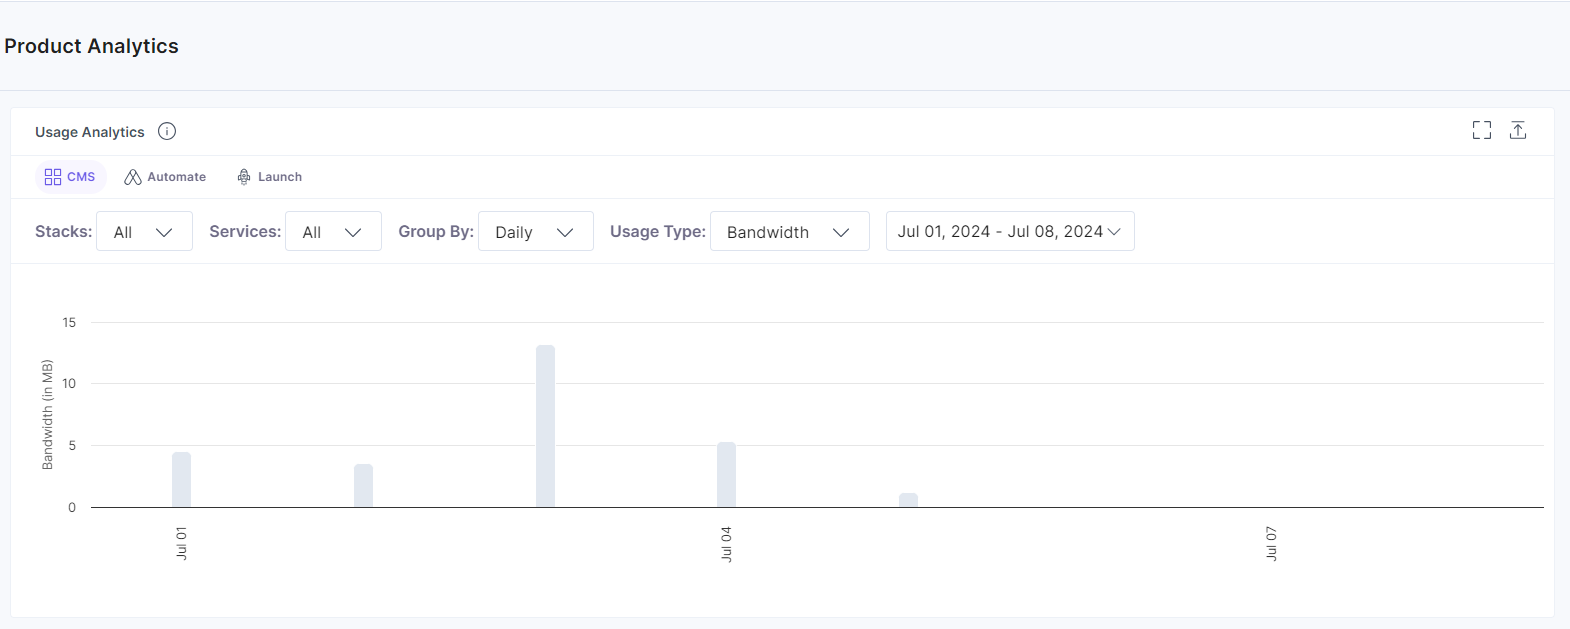
Hover over to any bin/bar in your chart and you can see the corresponding bandwidth usage (in MB) in that particular time stamp.
You can also view the bandwidth usage for different products including Automate, Launch, CMS etc.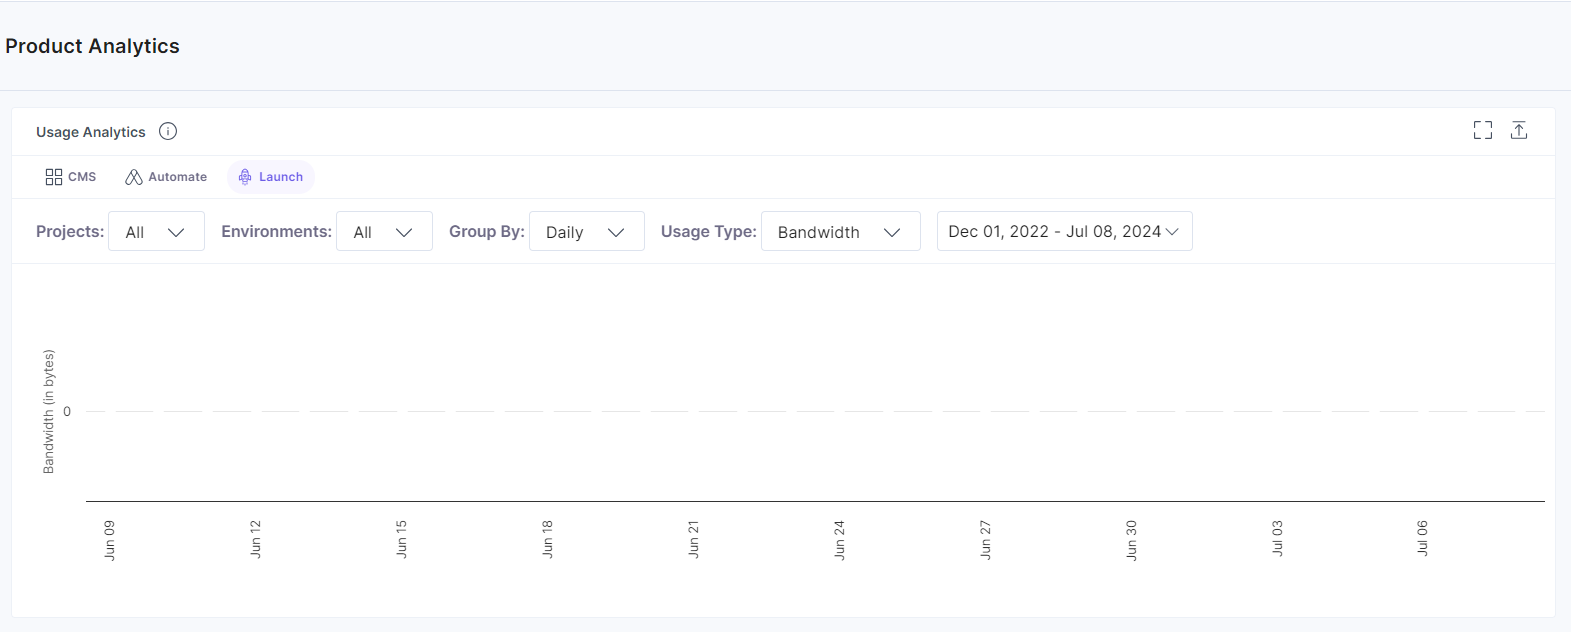
Click the Full Screen icon to view the data in full screen.
Additionally, you can save a copy of these statistics by downloading the chart. Click the Export icon in the top right corner of this section to download the PDF file.
API Requests
The API Requests usage view under the Usage Analytics section illustrates the API utilization over a particular period of time, using a bar chart. Time is mapped on the X-axis and the corresponding API utilization is mapped on the Y-axis.
You can set the time frame of your choice and get the desired results as shown below (for the CMS):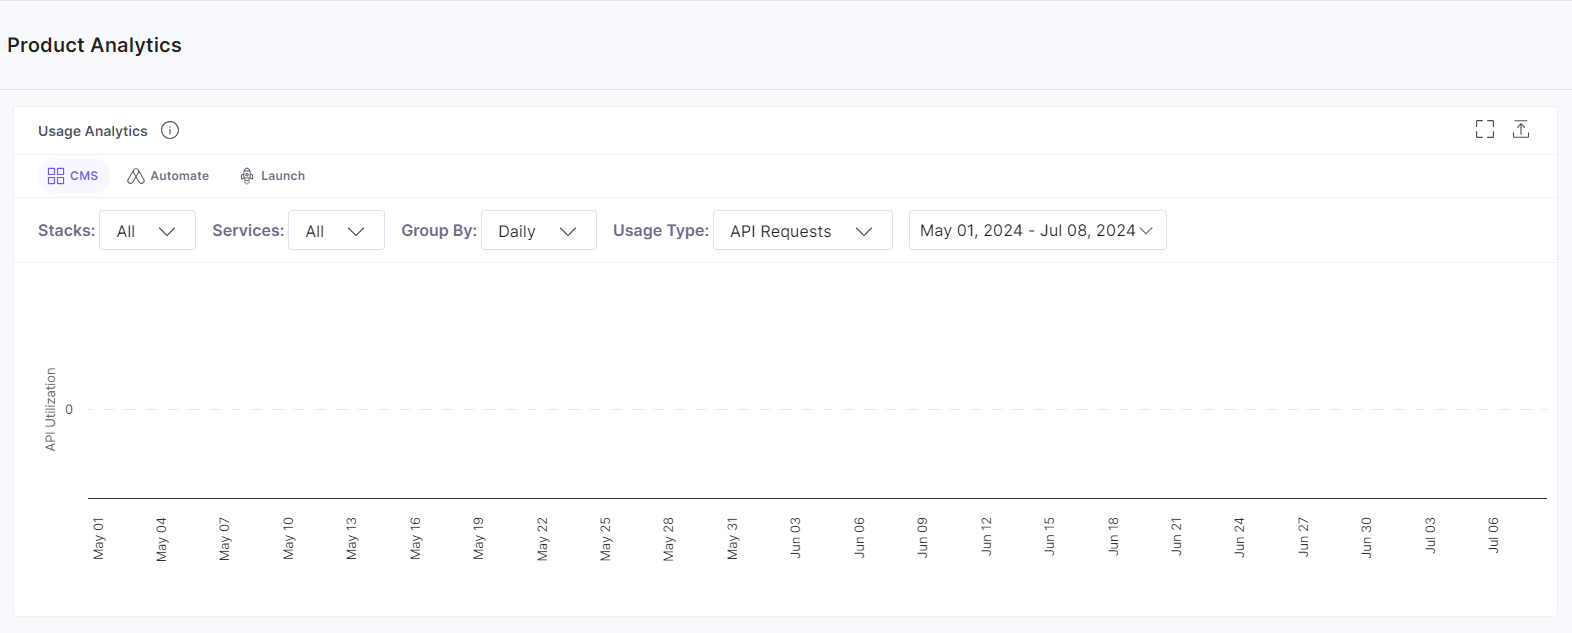
You can view the API utilization for Automate in the API Requests tab as follows: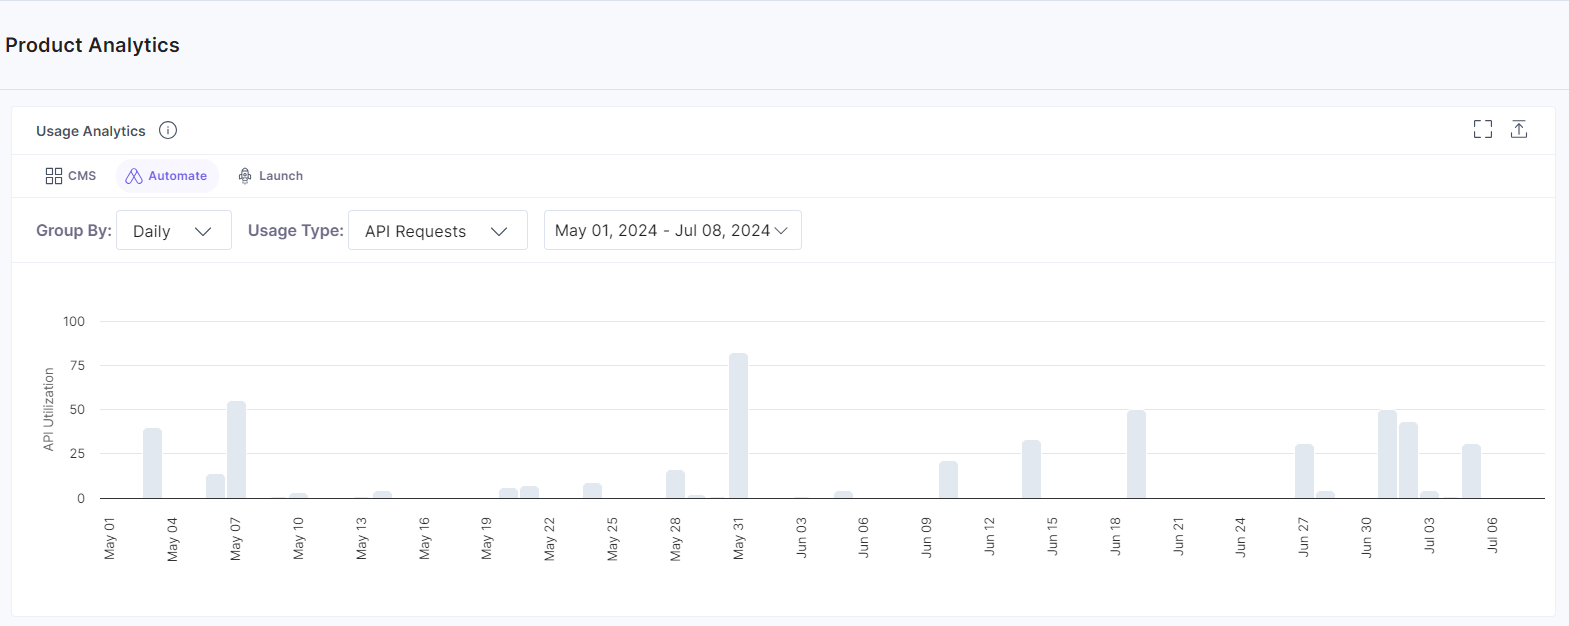
Similar to the Bandwidth section, you can hover over to any bin/bar in your chart and you can see the corresponding API utilization in that particular time stamp.
Click the Full Screen icon to view the data in full screen.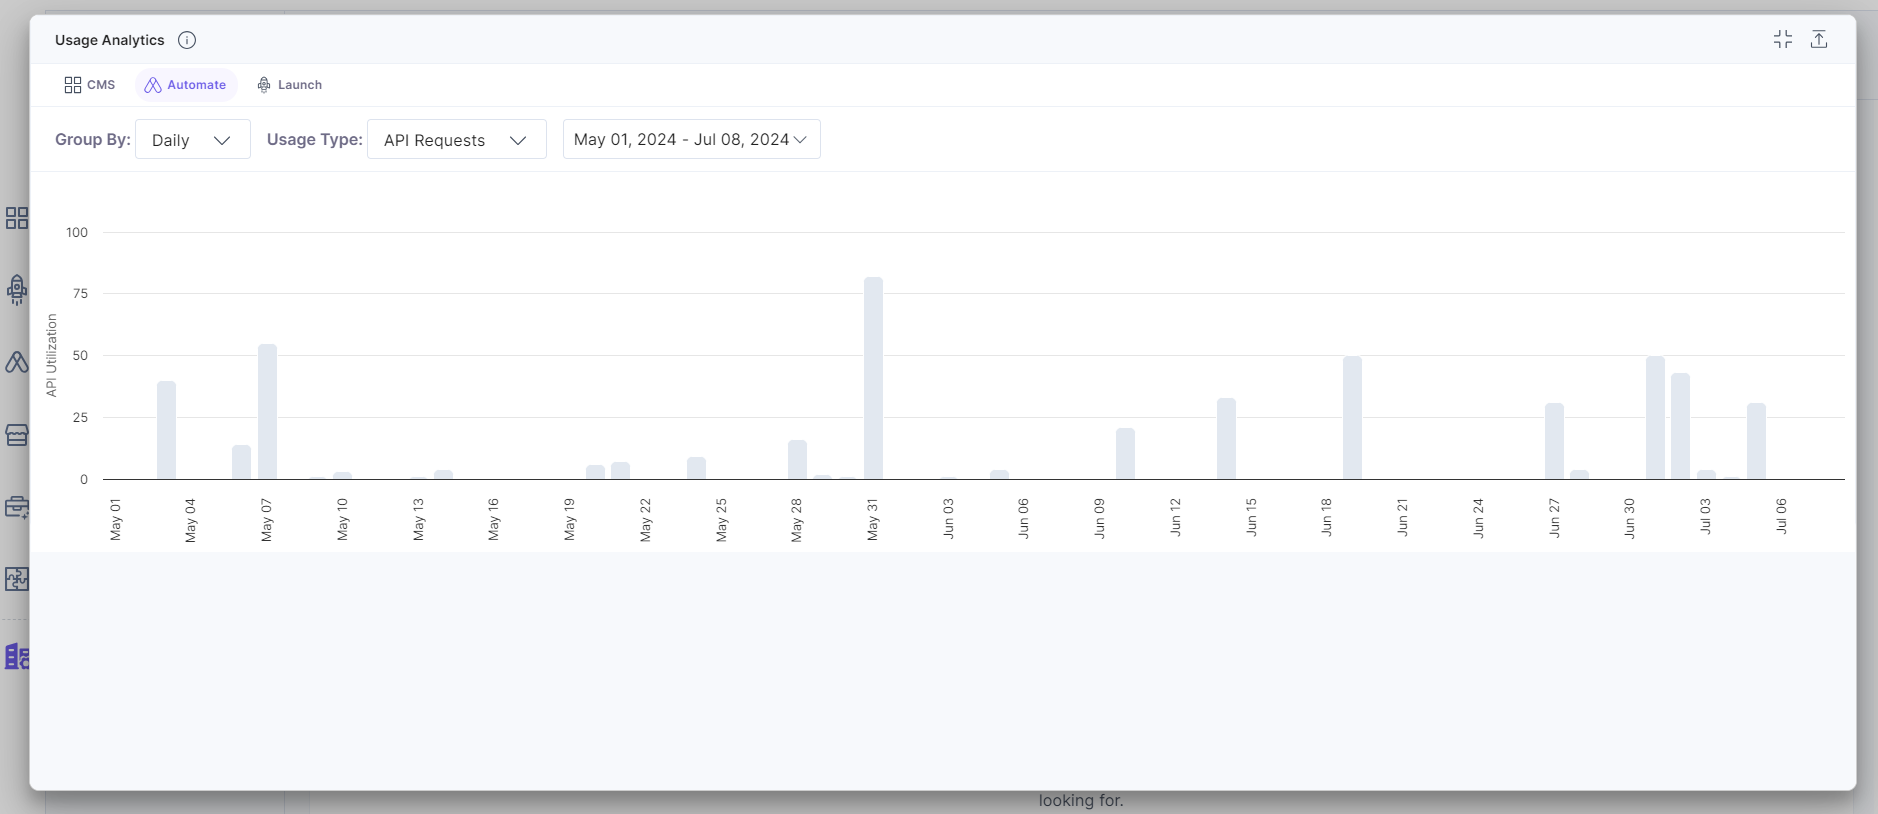
Additionally, you can save the data by downloading the chart. Click the Export icon in the top right corner of the section to download the PDF file.
Top URLs
The Top URLs section highlights the most frequently hit API URLs, along with the number of times those URLs were called. In this section you will find data in tabular format. Using this data you can easily track the top viewed URLs with the number of API requests.
Note: The data in this section is updated every 24 hours.
You can view the Top URLs for CMS, Automate, and Launch as shown below: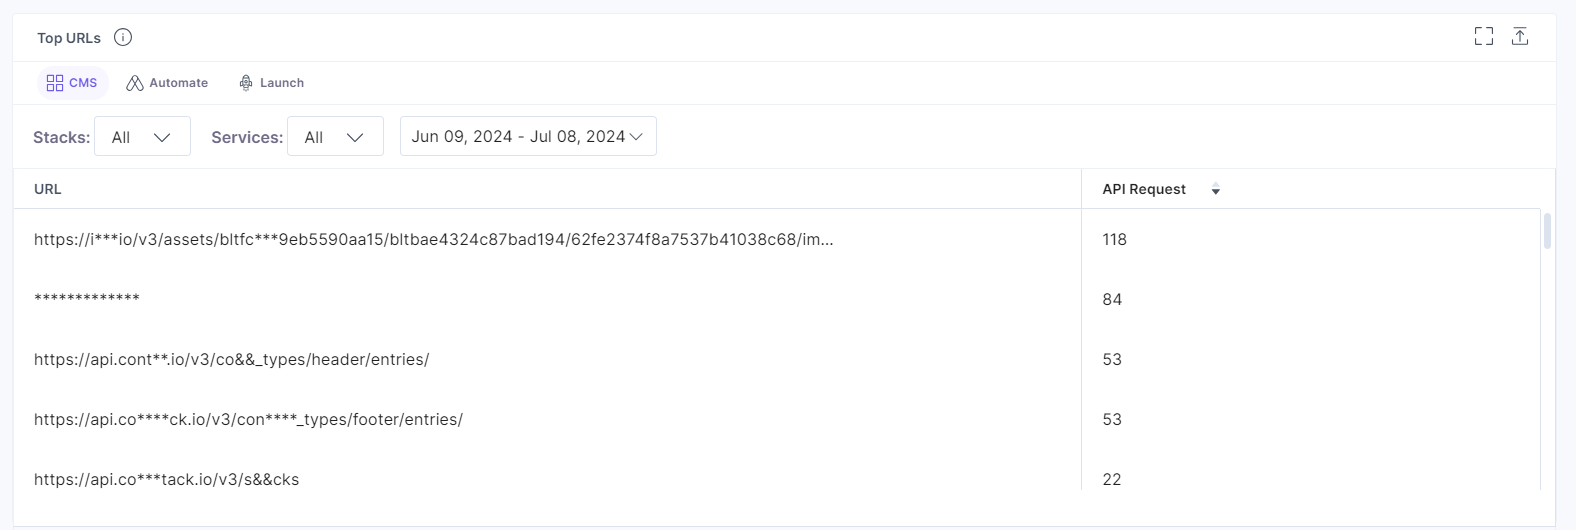
Click the API Request column heading to view the top/least API Requests.
Use the table filters given on the page to fetch data of a particular time frame and get your desired results as shown below: 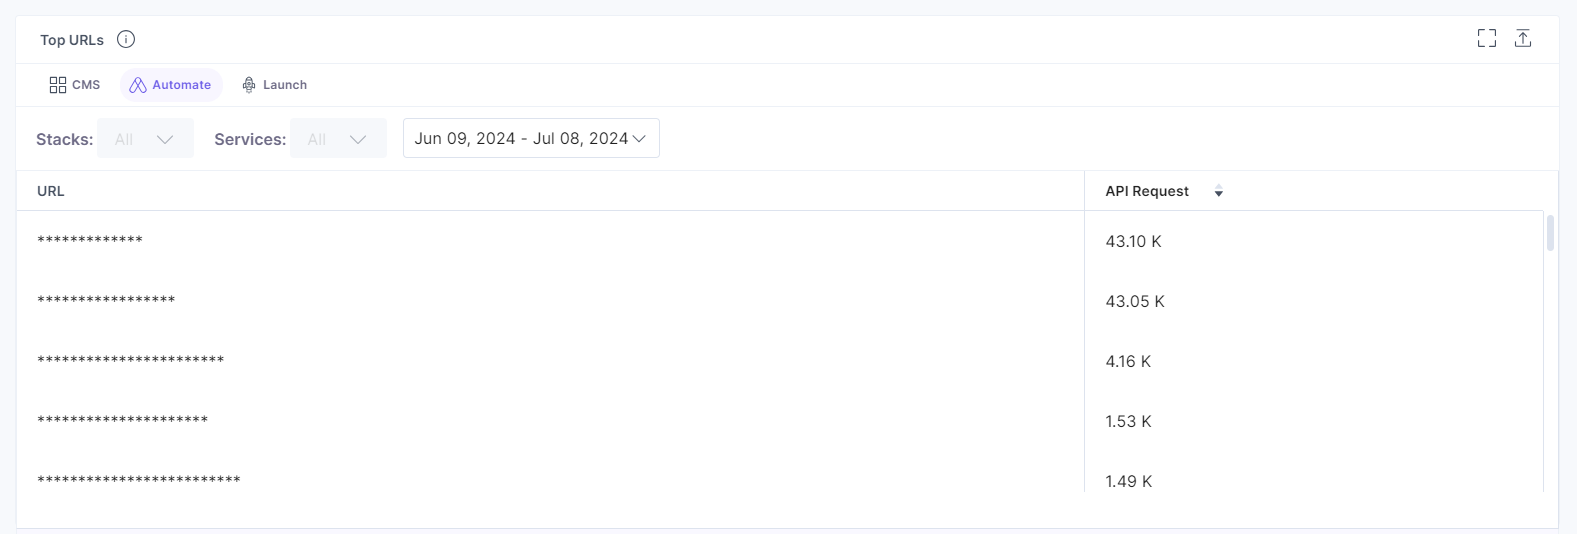
Click the Full Screen icon to view the data in full screen.
Additionally, you can save this data by downloading the Excel file, by clicking the Export icon in the top right corner of the section.
Apply Filters
Using Filters, you can filter the data of Usage Analytics and Tops URLs sections. You can retrieve data for specific service, specific group and/or specific duration.
Let’s learn more about these filters.
Services: Use this filter to view the usage data of only specific services. You can choose either a single service or all services at a time.
Group By: This filter will help you to view the usage data grouped by daily, weekly or monthly usage.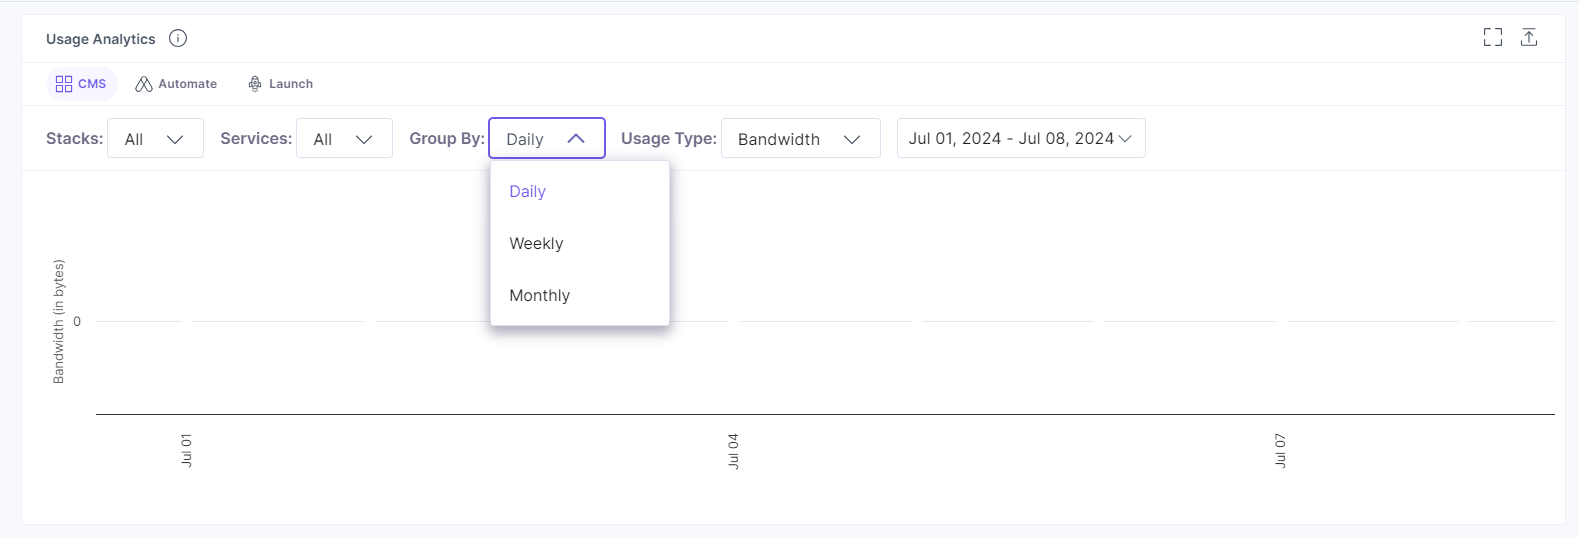
Duration: This filter gives you quick options to view data of the last 30 days, last 14 days, last 7 days or last 1 day. The Custom Date option lets you select a custom date range within the last 90 days as shown below: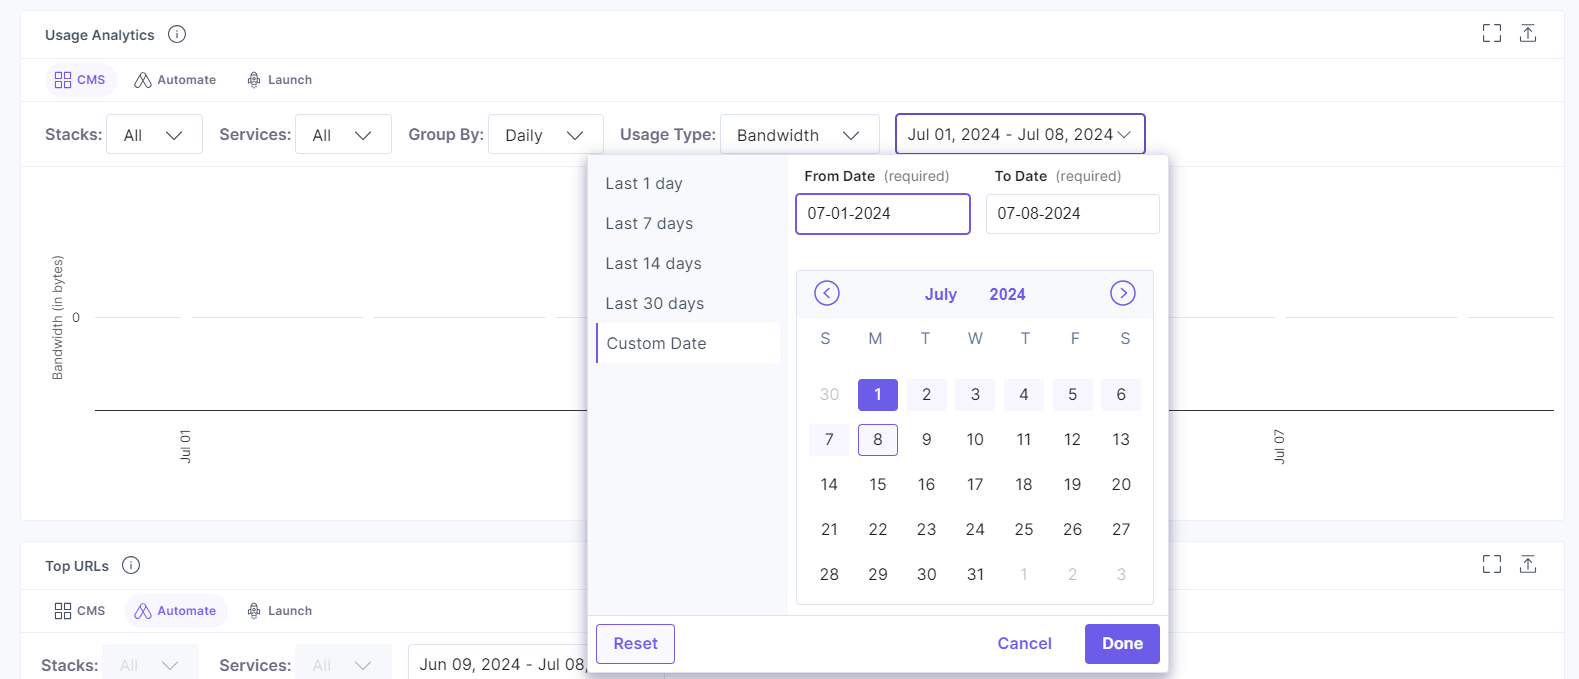


.svg?format=pjpg&auto=webp)
.svg?format=pjpg&auto=webp)
.png?format=pjpg&auto=webp)


.png?format=pjpg&auto=webp)