Mission Control
The Mission Control dashboard in Contentstack allows developers to access log data of your account and get an overview of your account’s health.
Moreover, these statistics can help you identify and track issues in your stack(org), which in turn makes it easier to resolve the issues. The Mission Control System helps you to proactively monitor customer error messages, alerts and outages.
Note: The Mission Control dashboard is a plan-based feature. If it is not part of your existing plan, get in touch with our support team to enable it.
The main objective of this dashboard is to provide you with the overall health of your organization and to minimize customer errors impact and API outages proactively. This is done by closely observing the data and actively working with our support team if any issues arise.
To access the Mission Control section of your Organization, perform the following steps:
- Log in to your Contentstack account.
- Click the Organization drop-down on the header, and click the “Org Admin” icon beside the Organization name that you need to open.
- Click the Mission Control tab to access the section.
Note: Only Organization Owners and Admins can access this section.
The following data metrics are available on the Mission Control dashboard:
Note: You can view the usage information based on an individual stack.
Let's understand each of these in detail.
Status Code
The Status Code section of the Mission Control page allows you to get a detailed status view of your API calls. It helps you understand and track down nominal API call details like number of success calls, bad calls and unsupported calls.
Status Code allows you to track the status of all the API calls made for CMS, Automate, and Launch. 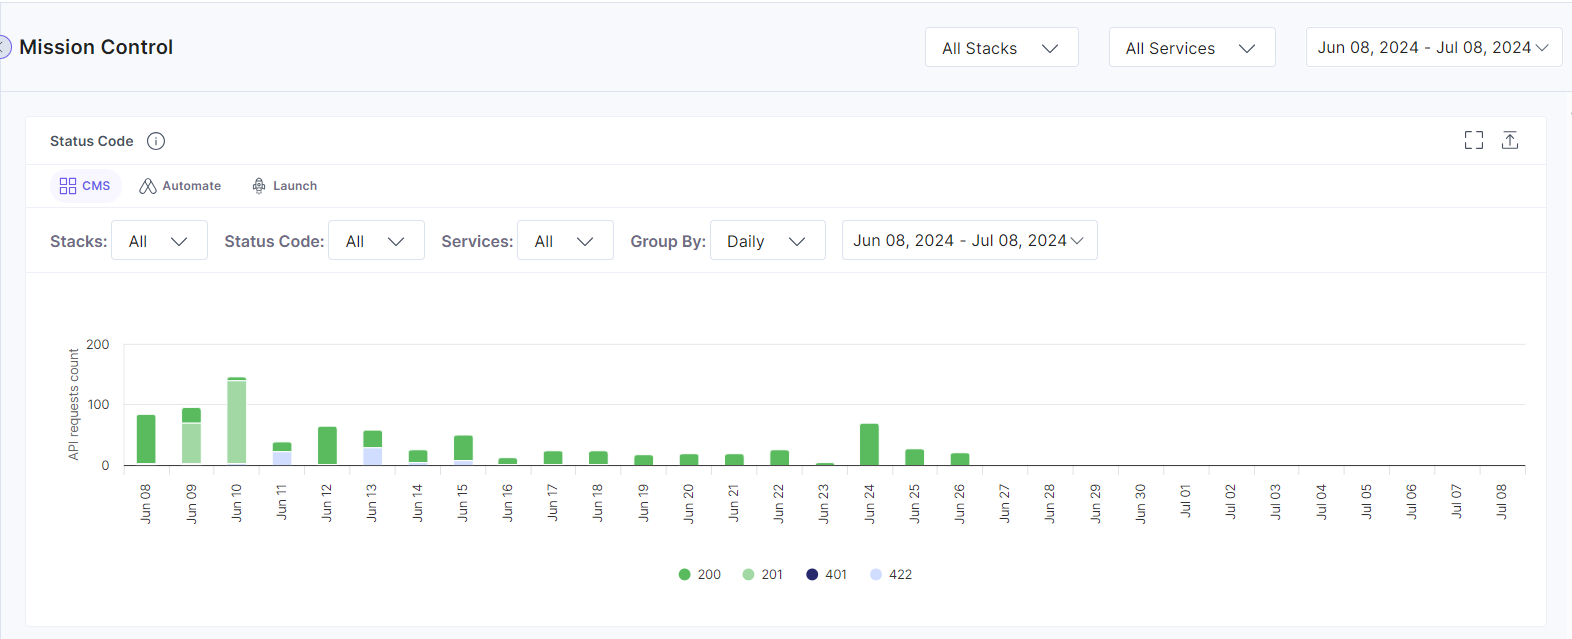
You can track the status of all the API calls made for Launch.
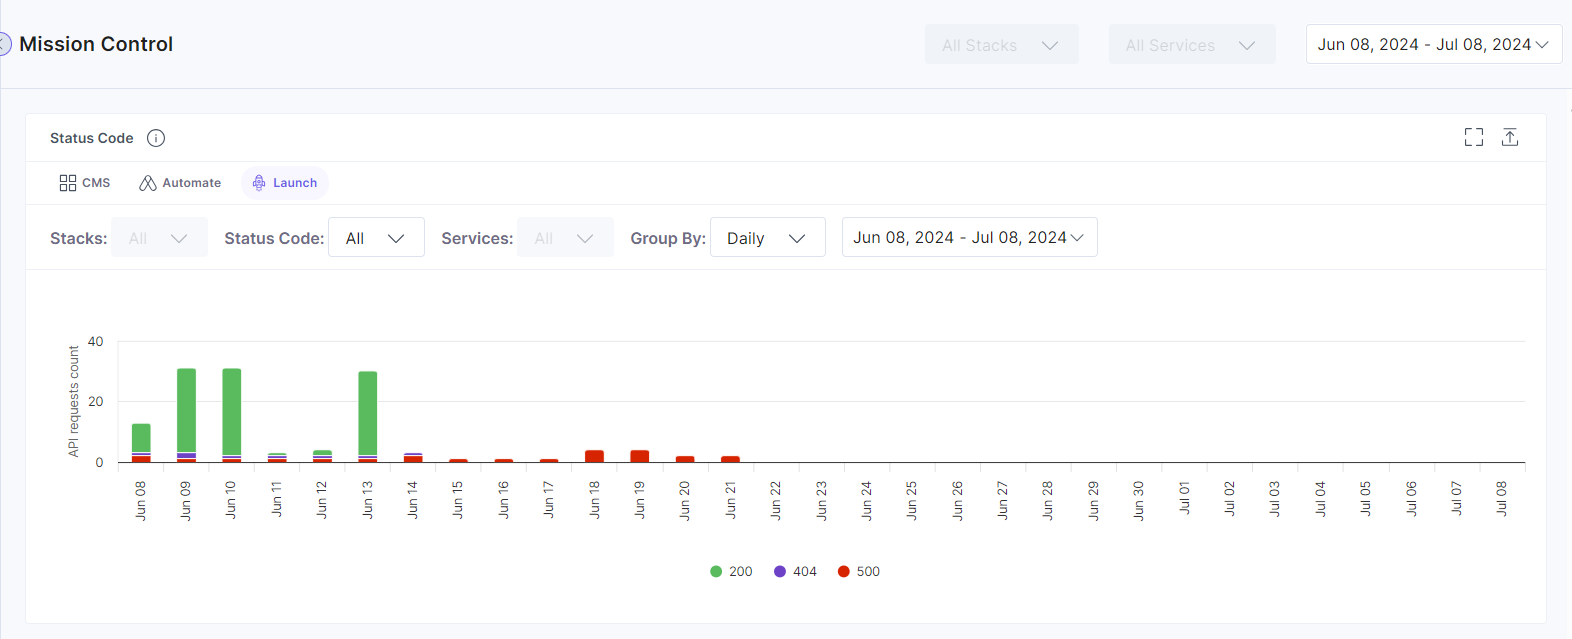
The stacked column chart offers a precise view of the status of API calls in a particular time frame. 
You can also use the following data filters to get the desired details.
- Status Code: Use this filter to sort your data according to the number of Status Code on a particular date.
- Date filter: You can filter your data according to a selected time frame by setting a date range. Using this filter you can easily track the performance of your recent release.
- Stacks: Use this filter to sort your data according to the stacks associated with your organization.
- Services: Use this filter to sort your data according to the different services such as Images, CDN, Assets, etc.
You can save a copy of these statistics by downloading the chart.
Click the Export icon in the right top corner of the page to download a PDF copy of the given data.
Cache Usage
The Cache Usage dashboard lets you see the hit/ miss ratio percentage of your API calls in a given time frame. 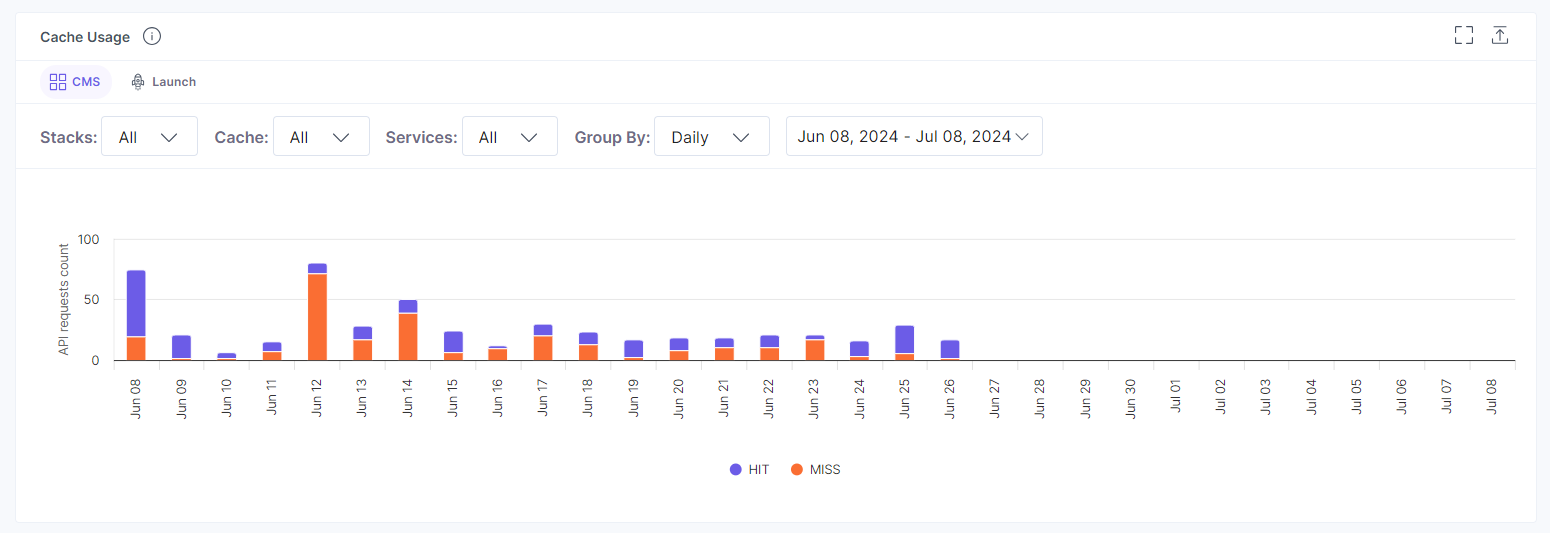
Additionally, use the following data filters to get the desired details.
- Cache: Use this filter to sort your data according to the number of Hits/ Miss API calls at a time.
- Date filter: You can filter your data according to a selected time frame by setting a date range. Using this filter you can easily track the performance of your recent release.
- Stacks: Use this filter to sort your data according to the stacks associated with your organization.
- Services: Use this filter to sort your data according to the different services such as Images, CDN, Assets, etc.
You can save a copy of these statistics by downloading the chart.
Click the Export icon in the right top corner of the page to download a PDF copy of the given data.
SDK Usage
This section gives you an overview of the SDK usage by your customers. With this data you can understand the SDK consumption of your customers.
The donut-shaped chart provides detailed insights about the consumption of SDKs, which can help you track individual SDK. 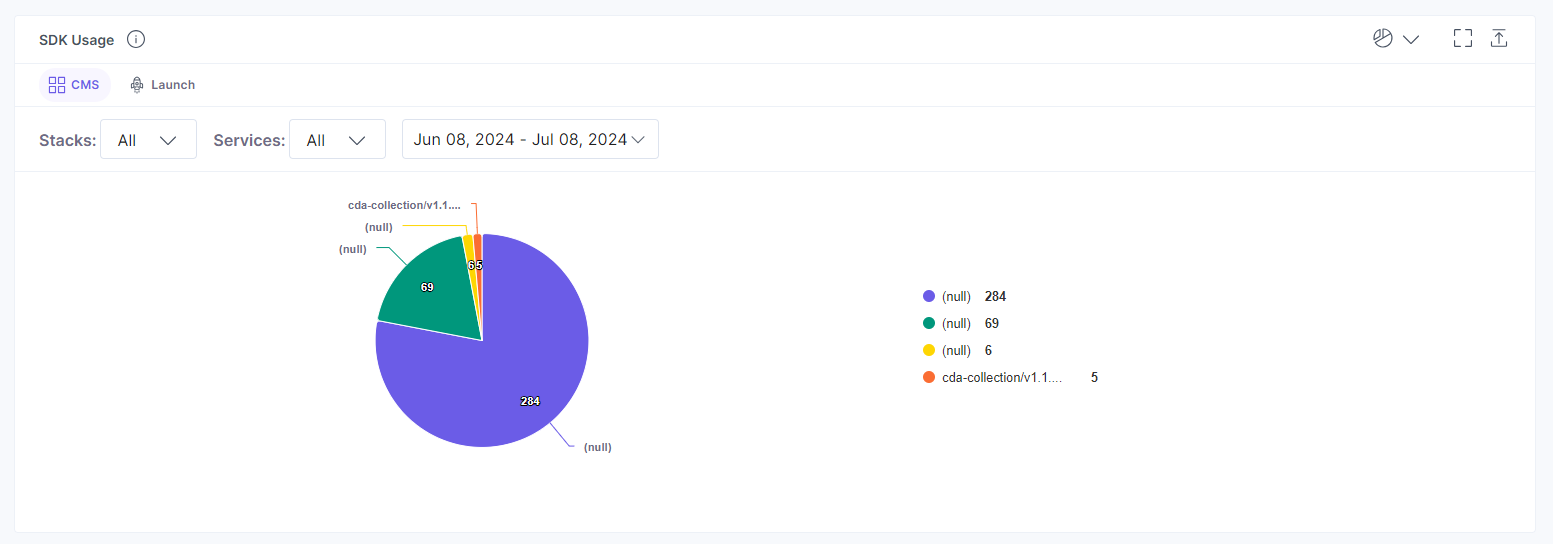
Here are some filters you can use to sort your data:
- Services: Use this filter to sort your data according to various services.
- Date filter: You can filter your data according to a selected time frame by setting a date range. Using this filter you can easily track the performance of your recent release.
- Change widget view: This filter allows you to view the data in tabular format by clicking on the Change widget view option.
- Top/ Least API Count: After enabling the tabular view, click API Count heading’s top arrow button, to view the least used SDKs. This data helps you understand and decide which SDKs you can continue to support.
Additionally you can save a copy of these statistics by downloading the chart.
Click the Export icon in the right top corner of the page to download a PDF copy of the given data.
Device Usage
Similar to the SDK Usage section, this donut-shaped chart allows you to understand and track the device usage of your customers. You can now find which devices your customers are using to access your website/ services.
You can then make your website user-friendly by optimizing images, etc., based on the devices that users are using most frequently to access your website. 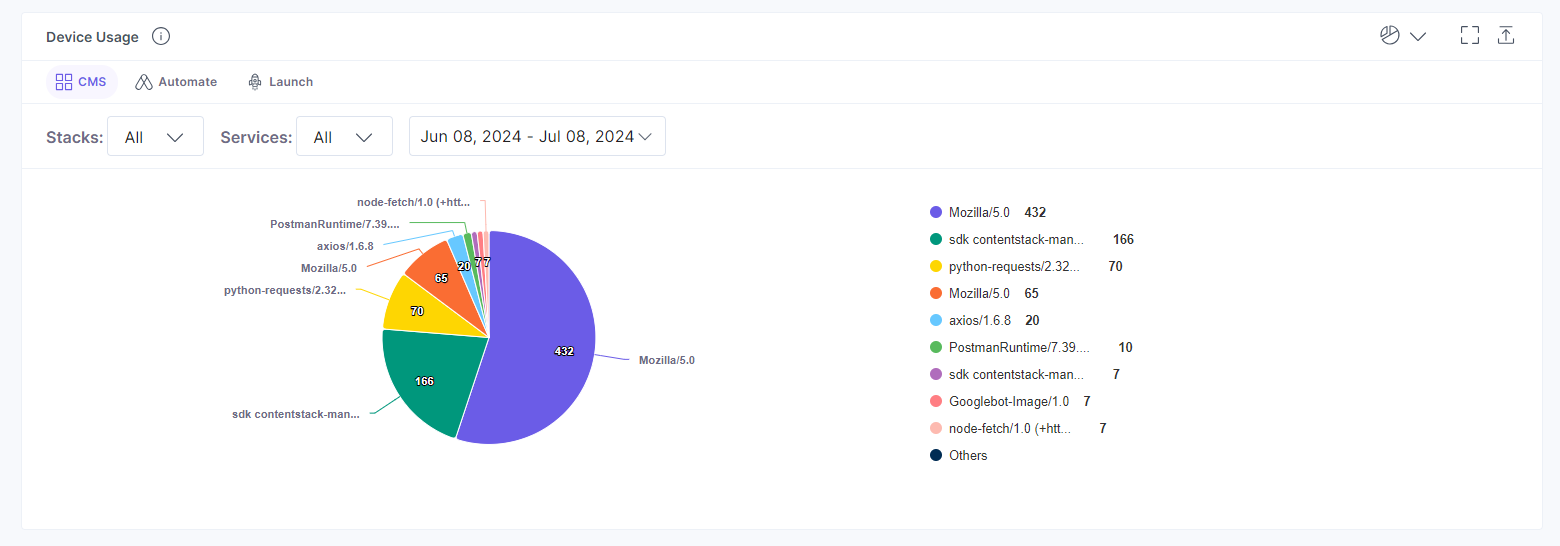
You can use the following data filters to get the desired details.
- Services: Use this filter to sort your data according to various services.
- Date filter: You can filter your data according to a selected time frame by setting a date range. Using this filter you can easily track the performance of your recent release.
- Change widget view: This filter allows you to view the data in tabular format by clicking on the Change widget view option.
- Top/ Least API Count: After enabling the tabular view, click API Count heading’s top arrow button, to view the least used devices. This data helps you understand and decide which devices you can continue to support.
You can save a copy of these statistics by downloading the chart.
Click the Export icon in the right top corner of the page to download a PDF copy of the given data.


.svg?format=pjpg&auto=webp)
.svg?format=pjpg&auto=webp)
.png?format=pjpg&auto=webp)


.png?format=pjpg&auto=webp)